Dataset Retrieval and Construction
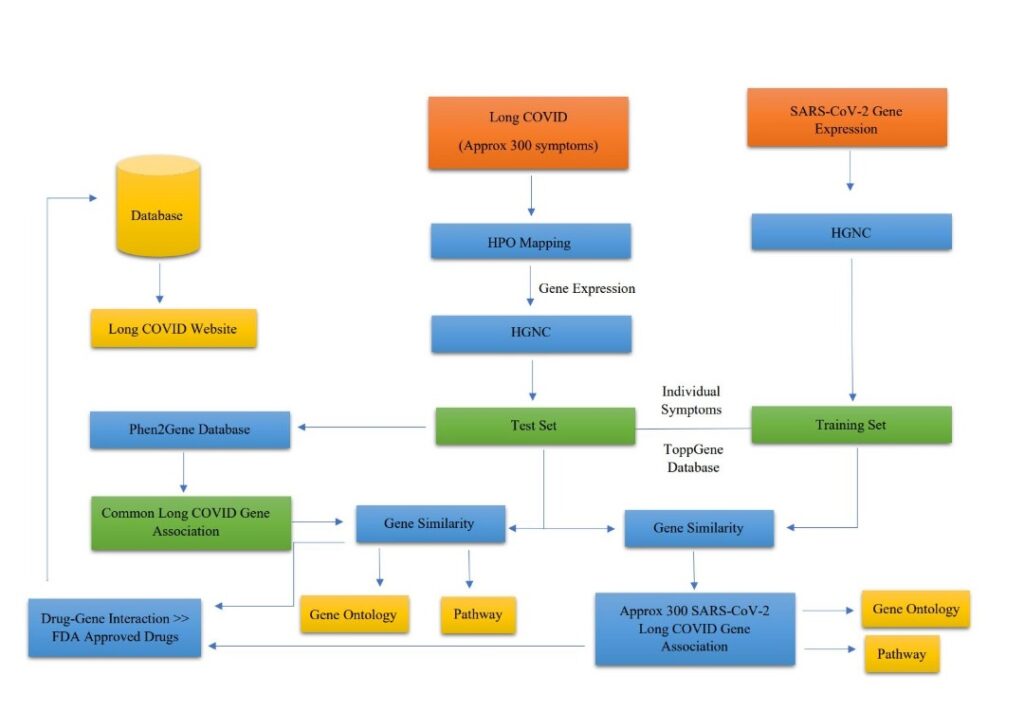
We have searched through all publications that reported for long COVID symptoms-systematic reviews, meta-analyses, and other publications (citing above all articles) from public repositories such as PubMed, LitCovid database, Embase database, etc. and have collected 255 symptoms of long COVID displayed in patients, published in peer-reviewed journals.
A gene list for the SARS-CoV-2 virus was created using data retrieved from the SARS-CoV-2 Infection Database (https://sarscovidb.org/), containing all differentially expressed genes (DEGs) identified after the SARS-CoV-2 infection, mined from various published articles in renowned scientific repositories, and H2V (http://www.datjar.com:40090/h2v/), which is a database containing all human proteins/genes that respond to SARS-CoV-2, SARS-CoV, and MERS-CoV. For this investigation, only the DEGs from each database were collected and merged.
Human Phenotype Ontology (HPO) concepts are increasingly being used to aid in the definition of patient phenotypes in diagnostic settings. Many HPO keywords are now mapped to putative causative genes with binary associations, and the HPO annotation database is routinely updated to offer precise phenotype information on a wide range of human diseases. Individual gene associations were extracted from the Human Phenotype Ontology (HPO) database (https://hpo.jas.org/app/) for each of the 255 symptoms included in this study. Each HPO ID corresponds to a phenotypic abnormality. After retrieving the individual gene lists, each symptom was categorized according to the organ system that was reported. The categories include autoimmunity, cardiovascular, dermatological, gastrointestinal, general symptoms, head, eyes, ears, nose, and throat (HEENT), lab, neuropsychiatric, pulmonary, and reproductive-genitourinary-endocrinological metabolism

Gene Ranking
ToppGene Suite (https://toppgene.cchmc.org/), a portal for gene list enrichment analysis and candidate gene ranking based on functional annotations and protein interaction networks, was used to compare each symptom dataset to the SARS-CoV-2 dataset. The training gene set was comprised of SARS-CoV-2 DEG (differentially expressed genes), while the test gene set was comprised of symptom genes. GO: Molecular function, GO: Cellular component, GO: Biological process, Human phenotype, Mouse phenotype, Pathway, PubMed, Interaction, co-expression atlas (human protein atlas), ToppCell atlas, and Disease were selected as training parameters. The following sub-parameters were chosen for the ToppCell atlas:
Bronchoalveolar lavage atlas of COVID-19 patients, bronchoalveolar lavage atlas of severe obstructive pulmonary disease COVID-19 patients, COVID-19 patients’ CD8+ memory T cells, COVID-19 autopsy atlas (lung, liver, kidney, heart), COVID-19 B cell and plasma cell atlas in PBMC and BAL, COVID-19 autopsy atlas (lung, liver, kidney, heart), COVID-19 BAL atlas, COVID-19 leukocytes derived from cerebrospinal fluid, COVID-19 lung atlas, COVID-19 lung autopsy data, COVID-19 PBMC myeloid cell atlas, COVID-19 PBMC neutrophil cell atlas, and COVID-19 PBMC platelet cell atlas, COVID-19 cDC atlas, COVID-19 T cell atlas (PBMC), and COVID-19 T cell atlas (BAL).
Combining five COVID-19 peripheral blood mononuclear cell (PBMC) datasets, Integration of multiple COVID-19 patient sampling locations Large-scale integration of immune-mediated diseases (COVID-19 + Influenza + Sepsis + multiple sclerosis) COVID-19 single-cell data, PBMC atlas of patients with COVID-19, and PBMC atlas of patients with COVID-19 and influenza. Human cell lines infected with SARS-CoV-2, upper airway, and bronchi atlas of COVID-19 patients.
Individual symptoms-Key genes identification using Protein-Protein Interaction analysis
The resulting prioritized genes were recorded from the Toppgene suite and further studied for hub genes using network analysis using Cytoscape.
The prioritized gene lists for each of the 255 long covid symptoms were, in turn, analyzed through Protein-Protein network analysis and the key genes were analyzed using CytoHubba (Chin et al., 2014) tool, which is a plugin in Cytoscape. It was used to rank the top 10 nodes for each symptom, from their respective STRING protein-protein interaction networks. CytoHubba uses 11 topological analysis methods, which cover Degree, Edge Percolated Component, Maximum Neighbourhood Component, Density of Maximum Neighbourhood Component, and Maximal Clique Centrality (six centralities). For this investigation, MCC was used.
All 255 symptoms Gene prioritization based on phenotype and hub gene identification
It has been reported that Long Covid has multiple symptoms that last longer. For this aspect, we are hoping to analyze all reported symptoms that can be used to infer prioritized genes and to comprehend the underlying mechanism.
The HPO IDs retrieved from the HPO database were entered into the Phen2Gene tool (https://phen2gene.wglab.org/), which is a real-time phenotype-based gene prioritization tool using HPO IDs. Using the default weight model criterion, which weights HPO terms by skewness, Phen2Gene ranked all the genes; the top 1000 genes as test set genes were then prioritized using functional similarity analysis against the training gene set of SARS-CoV-2 DEG (differentially expressed genes) in ToppGene Suite. The resulting prioritized genes from the Toppgene suite were analyzed using protein-protein interaction analysis for the identification of hub genes using Cytoscape. Cytohubba was used to identify the key top 10 genes in the network.
Identification of FDA of approved drugs for drug repurposing
The Drug Gene Interaction Database-DGIdb (https://www.dgidb.org/), a web resource that provides information on drug-gene interactions and druggable genes from articles, databases, and other web-based sources, was then used to enter each set of hub genes for all 255 symptoms as a list. This was done to identify at least one drug approved by the US Food and Drug Administration for each gene. The DGIdb compiled information from 22 different databases, 43 different gene categories, and 31 different types of interactions. Only drugs with an interaction value of more than 0.8 with the genes were included in the results (Supplementary File 1).
Gene Enrichment Analysis
Gene enrichment or functional enrichment refers to identifying enriched or overrepresented genes in a list of ranked genes, that have an association with a particular disease and its phenotypes. For this stage, gene ontology tables on biological processes, molecular function, and cellular components and KEGG pathway tables for each set of hub genes were retrieved from Enrichr (https://maayanlab.cloud/Enrichr/), a suite of gene set enrichment analysis tools.


